
Google Analytics GA4 dashboard showing website traffic, users and key events
Google Analytics is the free web analytics platform that shows you who visits your website, how they find you, what they do and which actions turn visitors into customers. Whether you run a blog, an online store or a service business, Google Analytics turns guesswork into evidence, so every content, SEO and advertising decision rests on real numbers instead of assumptions.
This guide explains how Google Analytics works today, how to set it up correctly, which reports and metrics deserve your attention, and what has changed in 2026. It is written for beginners and working marketers alike.
What Is Google Analytics?
Google Analytics is a free tool from Google that collects data about activity on your website or app and organises it into reports. The current version, Google Analytics 4 (GA4), replaced Universal Analytics in July 2023, so every active property today runs on GA4.
In simple terms, the platform answers four questions:
- Who is visiting (country, city, device, new or returning)
- Where they come from (organic search, paid ads, social media, email, direct, referral)
- What they do (pages viewed, scrolls, clicks, downloads, purchases)
- Why it matters (which actions contribute to leads and revenue)
Google Analytics vs Universal Analytics
The old version counted sessions and page views. GA4 is built around events, which makes it more flexible across websites and apps and better suited to a privacy-focused, cookie-limited web.
| Feature | Universal Analytics | Google Analytics 4 |
|---|---|---|
| Data model | Sessions and pageviews | Events and parameters |
| Conversions | Goals | Key events |
| Bounce rate | Primary metric | Replaced by engagement rate |
| Cross-platform tracking | Limited | Website and app in one property |
| AI insights | Minimal | Built-in predictions and anomaly alerts |
How Google Analytics Works
Understanding the data model saves hours of confusion later.
The Event-Based Data Model
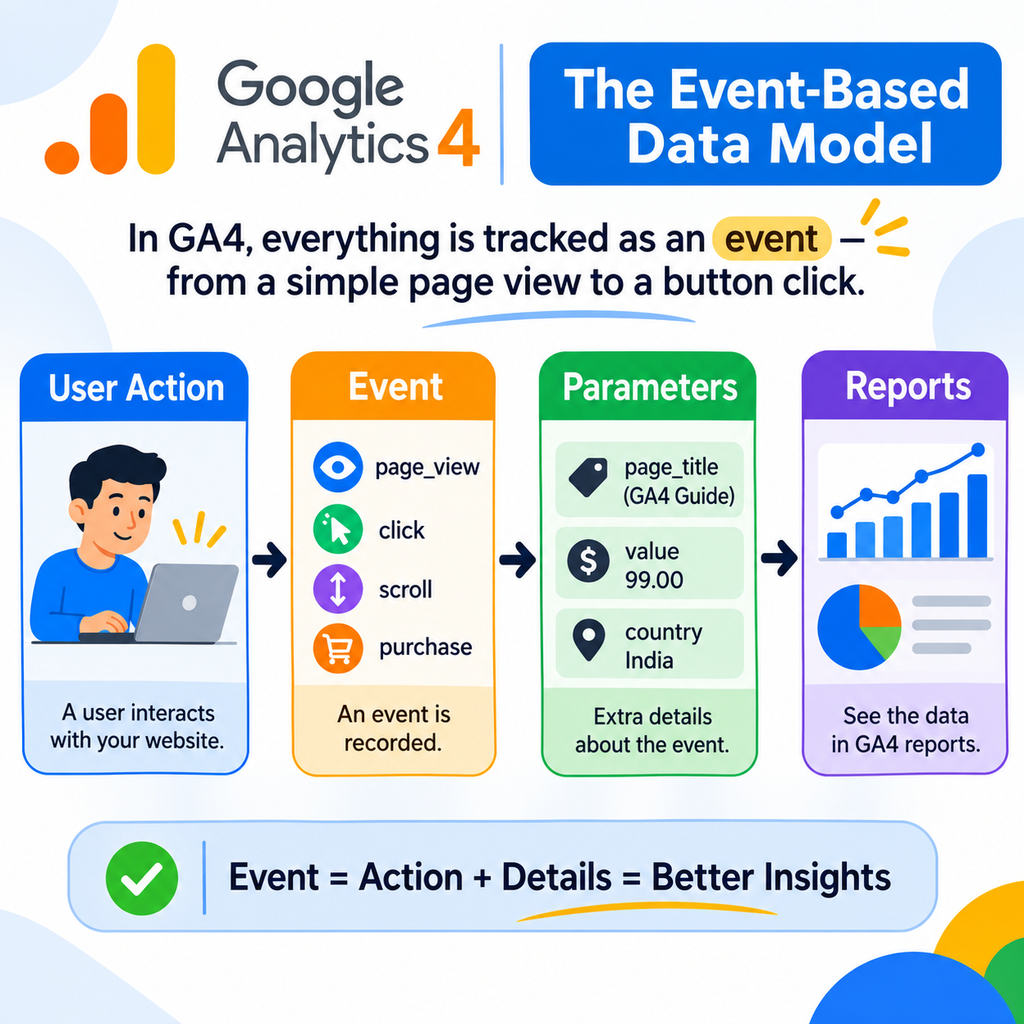
Every interaction in GA4 is recorded as an event. A page view is an event, a scroll is an event, a form submission is an event. Each event can carry extra details called parameters, such as the page title or the value of a purchase. Reports are simply organised views of these events.
GA4 also collects several events automatically, and the enhanced measurement setting adds scrolls, outbound clicks, site search and file downloads without any custom code.
Google Analytics event-based data model with events and parameters
Key Events (Formerly Conversions)
Any event that matters to your business can be marked as a key event. A completed purchase, a contact form submission or a brochure download are typical examples. The platform now calls these key events instead of conversions, and the same actions can be shared with Google Ads to measure campaign performance.
How to Set Up Google Analytics in 5 Steps
- Create an account and property. Sign in with a Google account, create an analytics account and add a GA4 property with your business details and time zone.
- Add a data stream. Choose Web, enter your site address and name the stream. You receive a Measurement ID that starts with the letter G.
- Install the tracking tag. Add the tag through Google Tag Manager, a WordPress plugin or by pasting the code in your site header.
- Define key events. Mark your most valuable actions, such as form submissions or purchases, as key events.
- Verify the data. Open the Realtime report, visit your own website and confirm that your visit appears within a minute.
Five steps to set up Google Analytics 4 for a website
Beginner tip: connect GA4 with Search Console and Google Ads right away so that search queries and ad data appear alongside your site behaviour.
Google Analytics Reports You Should Know
The left menu groups reports into clear sections.
- Reports snapshot and Realtime: a quick health check of what is happening now.
- Acquisition: shows which channels bring users and new users, such as organic search, paid search, social and email.
- Engagement: covers pages and screens, events, landing pages and how long people stay active.
- Monetization: tracks purchases, revenue and ecommerce performance.
- Retention: reveals how often visitors come back.
- Explorations: a flexible workspace for custom funnels, paths and segment comparisons that standard reports cannot show.
Google Analytics reports menu with Acquisition and Engagement sections
Spend most of your time in Acquisition and Engagement first. Add Explorations once you have specific questions, for example where users drop out of a checkout funnel.
Important Google Analytics Metrics to Track
There are more than a hundred metrics available, but a handful tell you most of what you need.
- Users and new users: the size and growth of your audience.
- Sessions: the number of visits to your website.
- Engagement rate: the share of sessions that were meaningful, which replaces the old bounce rate view.
- Average engagement time: how long people actively interact with your content.
- Key events and key event rate: how often visitors complete valuable actions.
- Traffic channels: which sources deliver users who actually convert, not just visit.
A useful rule is to match each metric to a business goal. Traffic growth supports awareness, key event rate supports lead generation and revenue supports sales. Vanity numbers that do not connect to a goal only create noise.
What Is New in Google Analytics in 2026
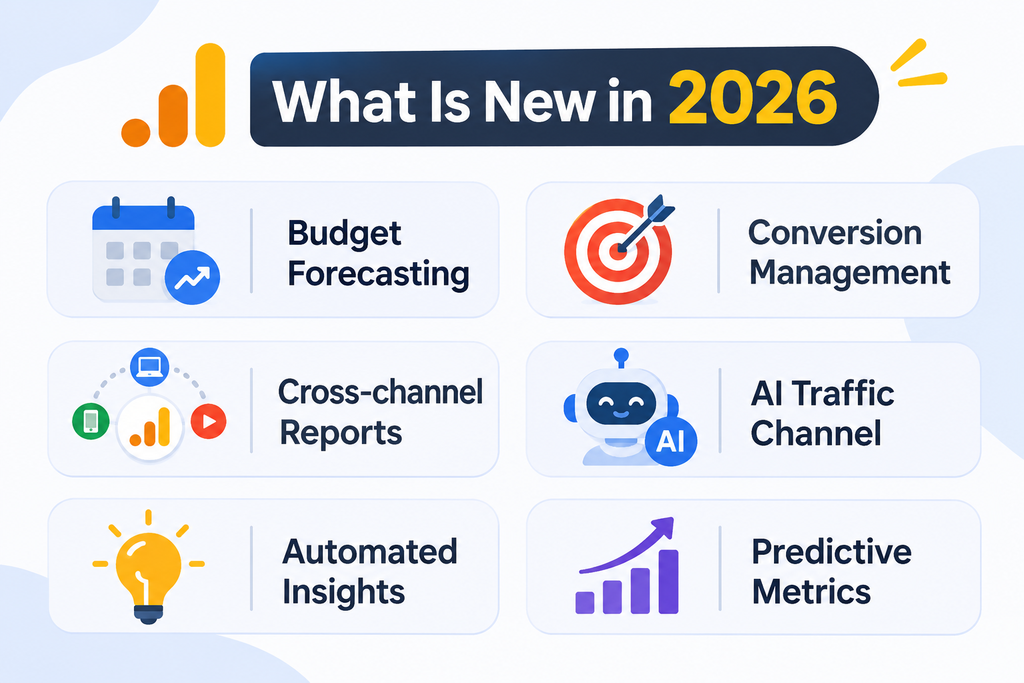
The platform has moved from passive reporting toward decision support. Features are rolled out in stages, so some may not yet appear in every property.
- Cross-channel budgeting and forecasting (beta): projections that help plan how budget is spread across channels.
- Flexible conversion management: more control over how key events are counted and which attribution window applies, which reduces mismatches with ad platforms.
- Cross-channel conversion reporting: new dimensions and filters that connect performance across marketing channels.
- AI traffic visibility: a dedicated channel group that helps identify visits coming from AI assistants and chatbots.
- Automated insights and anomaly detection: alerts and summaries that point out unusual changes without manual digging.
- Predictive metrics: machine learning estimates that support audience building and smarter bidding.
Google Analytics 2026 updates including forecasting and AI insights
The takeaway is simple: advanced features only work well when the basics are right, so audit your events and key event settings before relying on forecasts.
How Google Analytics Supports Your SEO Strategy
GA4 does not rank pages, but it shows whether your SEO is working.
- Find high-performing content: check the Landing pages report filtered to organic search and see which pages earn traffic and key events.
- Spot weak pages: low engagement time on a page with good rankings often means the content does not match search intent.
- Measure real outcomes: track leads and sales from organic traffic, not only visits.
- Combine with Search Console: link the two tools to see queries, impressions and clicks next to on-site behaviour.
- Watch new traffic sources: monitor AI assistant referrals alongside classic search.
Common Google Analytics Mistakes to Avoid
- Installing the tag twice, which inflates users and sessions.
- Skipping key event setup, so reports show traffic but no results.
- Counting your own team visits instead of filtering internal traffic.
- Ignoring data retention settings, which limits long-range Explorations.
- Reading data too early, since recent data can still be processing.
- Forgetting consent rules where regulations such as GDPR apply.
Privacy and Consent in Google Analytics
Regulations in the European Economic Area and other regions require clear consent before analytics cookies are used. Configure a consent banner, use Consent Mode where relevant, and review your data retention and data sharing settings. Respecting privacy protects your users and your brand, and it keeps your analytics data legally sound.
Frequently Asked Questions About Google Analytics
Is Google Analytics free?
Yes. The standard version is free and suits most websites. A paid enterprise tier exists for very large organisations.
What is the difference between users and sessions?
Users are the people visiting your website, while sessions are the individual visits they make.
How long does GA4 take to show data?
The Realtime report updates within moments, while standard reports can take up to a day to finalise.
Can I use GA4 for an app?
Yes. GA4 can combine website and app data in one property.
Do I need coding skills to use Google Analytics?
No. Basic setup works with plugins or Tag Manager, and coding is only needed for advanced custom tracking.
Conclusion
Google Analytics gives every website owner a clear window into audience behaviour, traffic quality and business results. Set it up properly, mark your key events, review Acquisition and Engagement reports weekly, and use Explorations for deeper questions. With the 2026 updates adding forecasting, smarter attribution and AI-powered insights, learning Google Analytics now is one of the most valuable skills in digital marketing.
Start with a clean setup today, and let your data guide every next decision.